
Monthly recurring revenue (“MRR”) is a fundamental metric for the valuation of SaaS-based businesses. While SaaS-based businesses generate MRR through their subscription products, some companies also generate transactional (or “re-occurring”) revenue by earning a transaction fee via payment processing platforms (e.g., Stripe, PayPal, or proprietary systems). For SaaS-based businesses that process end-user payments, monthly payment processing revenue (“payment revenue”) trends and volume (“payment volume”) can play a key role in the investment theses of investors.
The majority of SaaS target companies we see utilize a third-party payment processing platform/marketplace solution (such as Stripe or Paypal). Other companies provide a proprietary payment processing platform which serves similar functions.
Below are the key payment processing revenue considerations we evaluate for targets with payment processing revenue.
1. Payment volume of end-user payments
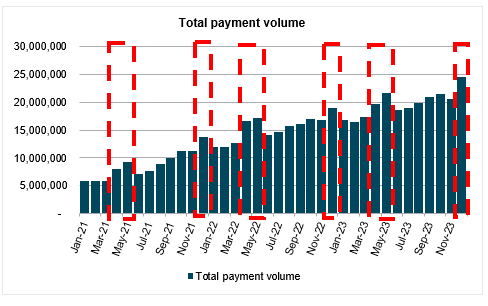
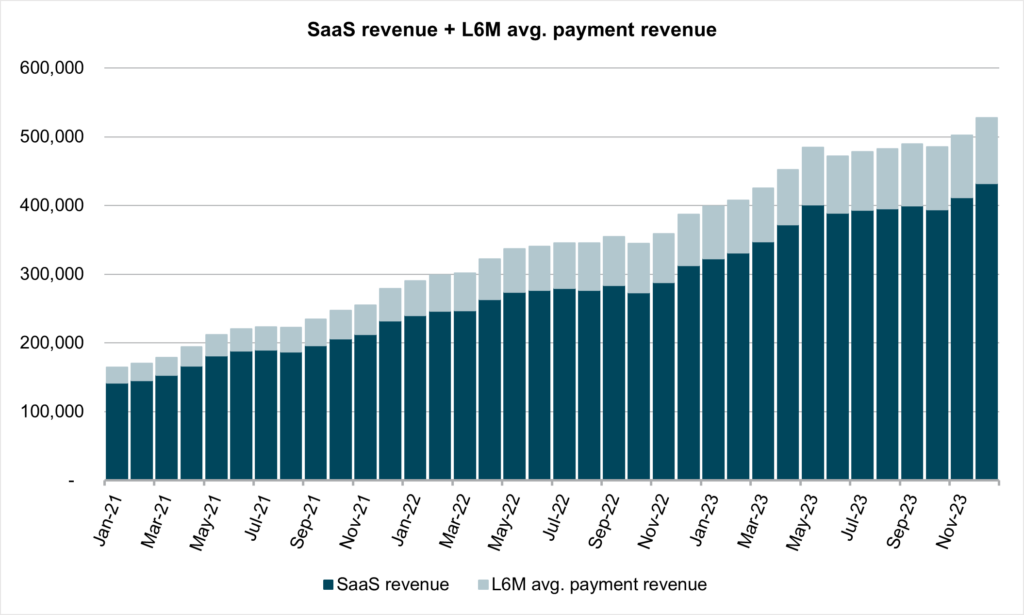
The key driver of monthly payment revenue is the volume of payments processed by a company’s SaaS platform. Analyzing month-to-month payment volume variability will help interested parties better understand any recurring trends within payment revenue. Seasonality, in particular, will impact run-rate payment revenue analyses as higher or lower payment volume in a given month may be caused by underlying seasonal demand. For example, in the graph shown below, payment volume increases in April, May, and December of each year when compared to surrounding months. As such, investors should be aware of these trends in their forecasting and valuation processes.
2. Payment processing residuals (“net take”) paid to the SaaS company
After assessing payment volume trends, a company’s payment processing residual (“net take”) is the next key area of analysis. When utilizing third-party payment processing platforms, we typically see SaaS-based businesses earn 20 to 60 basis points (“bps”) of each end-user payment collected by the company’s customers as a commission (or “residual”). Although net take rates are typically contracted amounts easily identifiable in agreements between the SaaS-based business and its respective payment processing platform, the weighted average net take rate can be observed by dividing total payment revenue by total payment volume. Buyers and sellers should understand the company’s payment processing residual rate in tandem with payment volume trends as these two metrics directly impact future payment processing revenue trends in projection models.
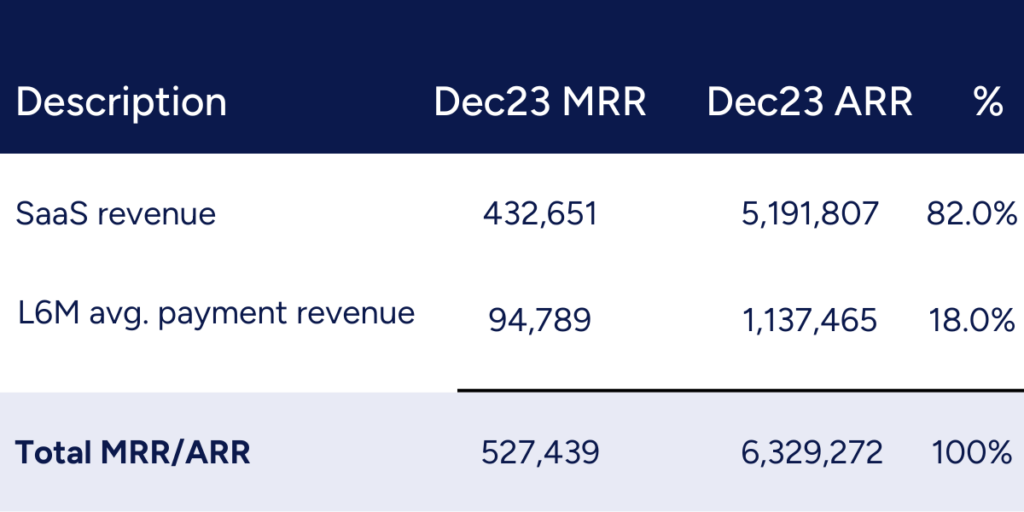
3. Inclusion of re-occurring payments revenue in MRR
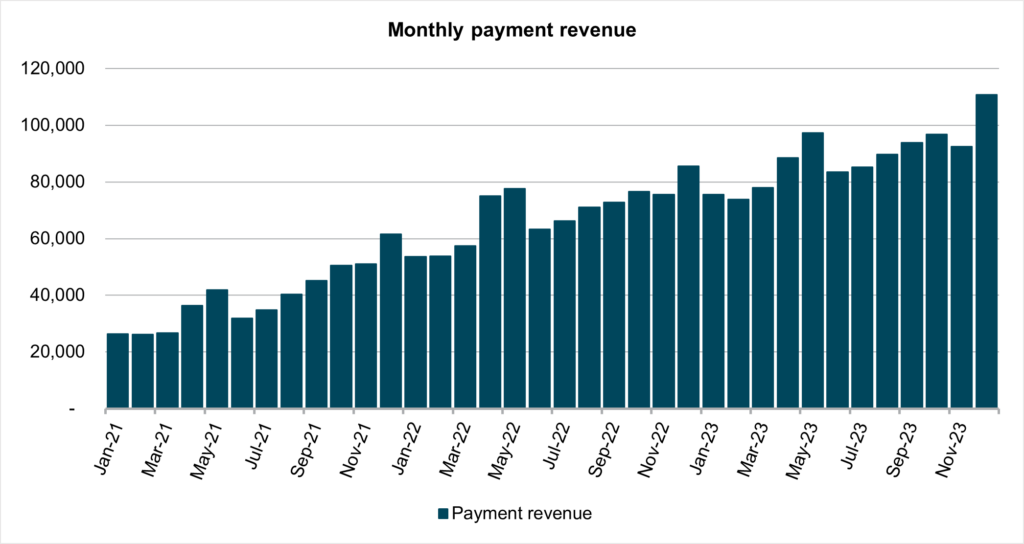
Once payment volume trends and payment processing residuals have been analyzed, the inclusion of payments revenue in MRR can be considered. We rarely see “monthly” payment revenue (e.g., December 2023 payment revenue) included in MRR as the natural month-to-month payment volume variability can set misleading high or low-water marks for run-rate payment revenue.
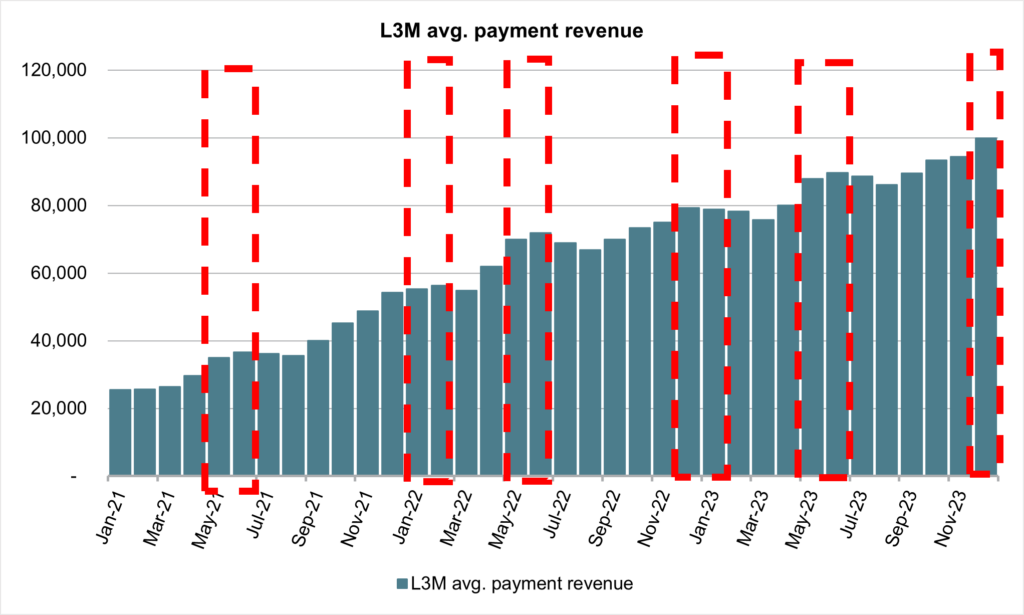
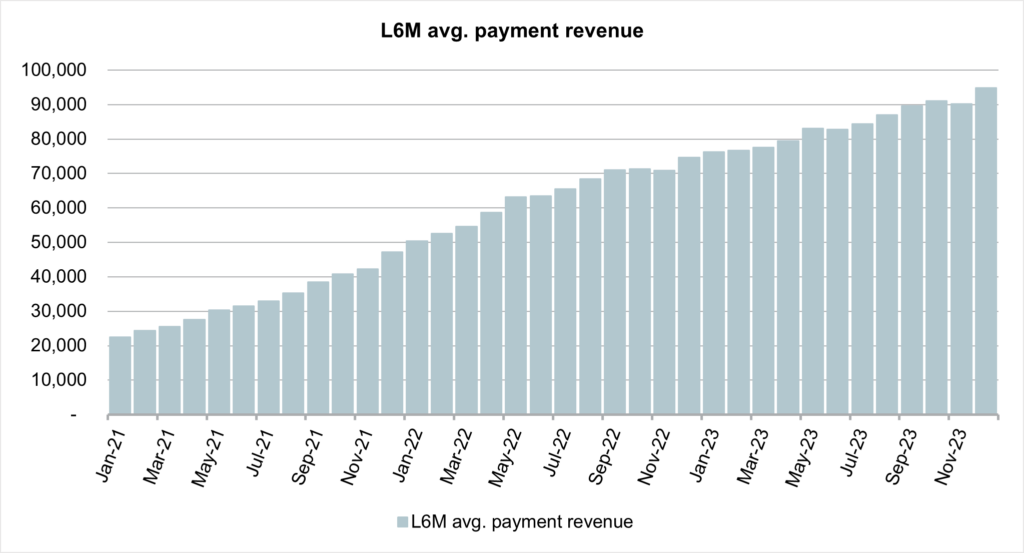
The volume-based nature of payment revenue requires other methodologies (e.g., using the last three-month (“L3M”) or last six-month (“L6M”) averages) to be utilized in determining the payment revenue to be considered as MRR. Using the L3M or L6M averages (i) helps smooth the aforementioned month-to-month or seasonal variability of payment volume and (ii) accounts for payment revenue growth over time.
The decision to include re-occurring payment revenue in the calculation of MRR is a subjective item in SaaS M&A transactions as it relates to adding the re-occurring (i.e. somewhat variable) payments revenue to the fixed subscription MRR. The transaction advisory team at ML&R is experienced and well-equipped to help you in your understanding and analysis of payment revenue. Request a redacted report today to see the ML&R difference.